Most people meet budget variances the first time as a scary red number in a spreadsheet. Let’s make it a lot less scary.
Below is a friendly, step‑by‑step guide to understanding what those variances really mean, how to read them, and how to actually use them to make better decisions in 2025 and beyond.
—
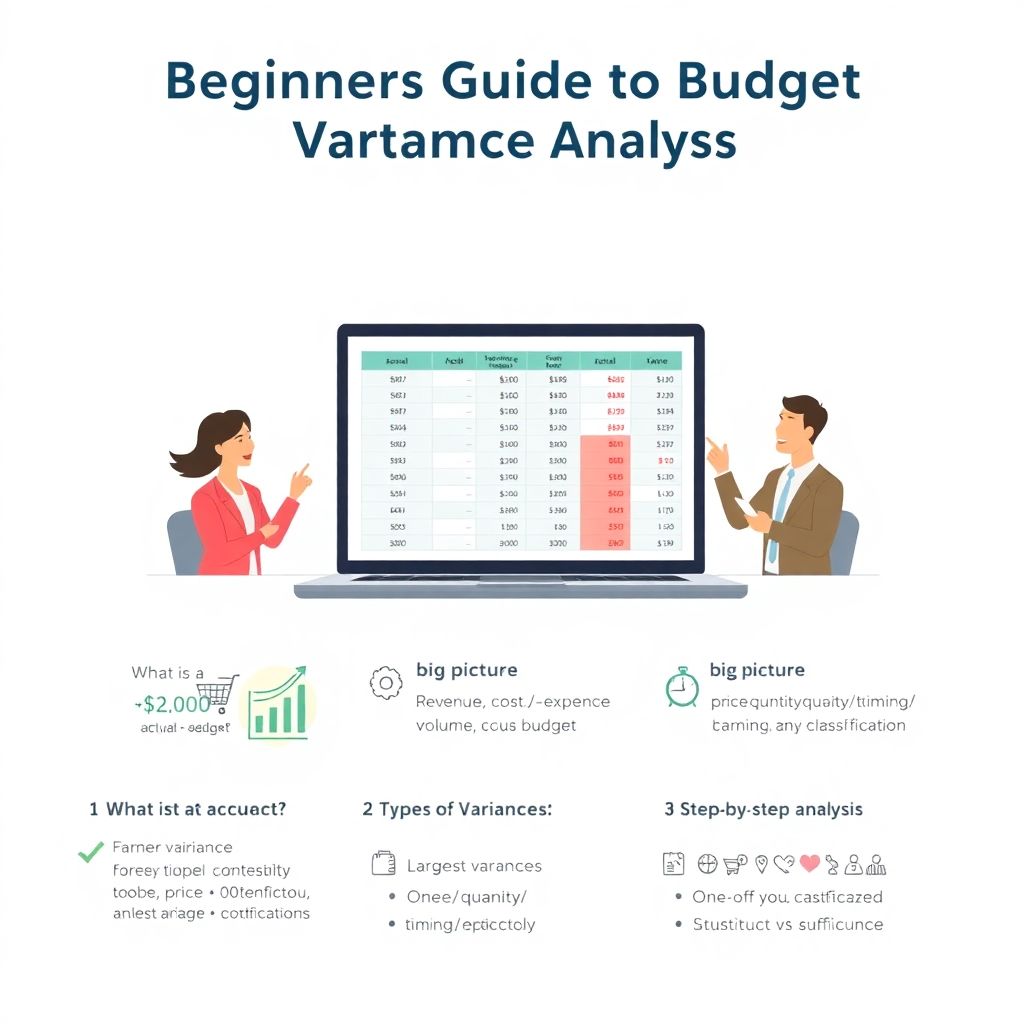
1. What Exactly Is a Budget Variance?
A budget variance is simply the difference between what you planned to spend or earn and what actually happened.
– If you expected $10,000 in sales and got $12,000 → variance is +$2,000 (favorable).
– If you expected $10,000 in costs and paid $13,000 → variance is -$3,000 (unfavorable).
That’s it. No fancy magic. Budget variance analysis for beginners is really just comparing “budget vs. reality” and asking “why?”.
Short version:
Variance = Actual – Budget.
– Positive variance in revenue → usually good.
– Positive variance in cost → usually bad.
– Negative variance in revenue → bad.
– Negative variance in cost → good.
Context matters, but that’s the basic logic.
—
2. A Tiny Bit of History (Why We Even Care About Variances)
People have tracked money for thousands of years, but systematic budgeting is relatively new.
– In the late 1800s and early 1900s, big factories and railroads started using formal budgets to control costs.
– By the 1920s–1930s, “standard costing” and variance analysis became part of serious management accounting.
– After World War II, companies exploded in size and complexity, and executives leaned heavily on budget vs actual reports to keep control.
– In the 1990s and 2000s, spreadsheets took over. Monthly budget variance reporting templates in Excel became standard tools in finance teams.
– Now, in 2025, budgeting and forecasting software with variance analysis is everywhere, from huge ERPs to simple SaaS dashboards, and even freelancers are looking at planned vs actual performance.
So when you analyze variances today, you’re using tools that evolved over a century of trial and error. The idea hasn’t changed much: plan, act, compare, adjust.
—
3. Types of Budget Variances You’ll See All the Time
3.1 Revenue variances
This is the gap between budgeted sales and actual sales.
Typical reasons:
– Sold more or fewer units than expected.
– Prices were higher or lower than planned.
– Promotions worked better or worse than hoped.
Example:
You budgeted $50,000 in monthly revenue, but actual is $60,000. That’s a favorable $10,000 variance. Great — but you still need to ask *why*.
—
3.2 Cost and expense variances
This is the difference between planned costs and actual costs.
Reasons can include:
– Raw materials got more expensive.
– Wages, overtime, or bonuses were higher.
– You cut some spending intentionally.
– Unexpected repairs or one‑off events.
Example:
You budgeted $20,000 for marketing; actual was $15,000. That’s a favorable $5,000 cost variance… unless revenue also dropped because you advertised less. Then “good” becomes questionable.
—
3.3 Volume vs. price vs. efficiency
As you go deeper, you’ll hear things like:
– Volume variance – did we sell more/fewer units?
– Price variance – did we charge more/less per unit (or pay more/less per unit)?
– Efficiency variance – did we use more/less inputs (hours, materials) than planned?
As a beginner, you don’t need to master all the formulas right away. Just remember:
Most variances come from how many, what price, or how efficiently you worked.
—
4. Step‑by‑Step: How to Analyze Budget vs Actual Performance
Let’s break how to analyze budget vs actual performance into clear, repeatable steps you can actually use.
Step 1: Start with the big picture
Look at:
– Total revenue: budget vs actual.
– Total expenses: budget vs actual.
– Profit (or surplus): budget vs actual.
Don’t jump into micro-level details yet. First, understand:
– Are we overall above or below expectations?
– Is the problem mainly on the revenue side, the cost side, or both?
—
Step 2: Focus on the largest variances first
Open your report or spreadsheet and sort by variance size (absolute value, not just positive/negative). This keeps you from drowning in tiny line items.
Pay attention to:
– Variances that are large and recurring.
– Variances that affect strategic goals (e.g., key product lines).
Newbie tip:
Ignore small variances at first. It’s better to truly analyze three big ones than skim 30 tiny ones.
—
Step 3: Ask “price, quantity, timing, or classification?”
When you see a big variance, ask:
1. Price – Did we pay or charge a different price than planned?
2. Quantity/volume – Did we sell or use more/less than expected?
3. Timing – Did something just happen earlier or later than the budget assumed?
4. Classification – Was something booked under the wrong account or project?
Often, the story is a mix. For example:
– You sold fewer units (bad volume), but at higher prices (good price), and marketing costs shifted from March to April (timing).
—
Step 4: Separate one‑off events from structural issues
Big question:
Is this variance a one‑time surprise or a new normal?
– One‑off examples: flood damage, a single big client order, a one‑time grant, a broken machine.
– Structural examples: permanent rent increase, sustained change in market demand, new salary levels.
This matters because:
– One‑offs might not change next year’s budget.
– Structural changes absolutely should influence forecasting.
—
Step 5: Turn findings into actions
Budget variance analysis is pointless if nothing changes.
Your actions could be:
– Adjust prices or discount strategy.
– Renegotiate supplier contracts.
– Shift spending to higher‑return activities.
– Update your forecast and next period’s budget.
A simple rule:
Every major variance should either trigger a decision, an experiment, or a note for future budgeting.
—
5. Common Beginner Mistakes (And How to Avoid Them)
5.1 Treating all variances as good or bad by default
Not every unfavorable variance is bad, and not every favorable one is good.
Examples:
– You spent more on training than planned (unfavorable), but staff productivity improved and errors decreased.
– You spent less on maintenance (favorable), then had a big breakdown and production stopped.
Always ask: *What is the impact on long‑term results, not just this month’s numbers?*
—
5.2 Ignoring small recurring variances
A $300 unfavorable variance every month looks harmless. Over a year, that’s $3,600. Over 5 years, that’s $18,000.
Patterns matter more than single snapshots. Watch out for:
– The same line overspending slightly every period.
– Tiny but consistent revenue shortfalls in one product.
—
5.3 Confusing timing differences with real problems
Classic example:
– You budgeted an insurance payment in March, but you paid it in February.
– March shows a big favorable variance, February shows an ugly unfavorable one.
– Total for the year? Exactly as budgeted.
Timing differences are emotional traps. They look alarming but change nothing over the full period. That’s why experienced analysts check the year‑to‑date or quarter‑to‑date view.
—
5.4 Overcomplicating everything on day one
Some people dive straight into advanced formulas, variance decomposition, and fancy models. Then they burn out and stop doing analysis altogether.
Start simple:
– Compare budget vs actual.
– Focus on the top few differences.
– Write short, clear explanations.
As you get comfortable, you can layer in more advanced techniques or even take a structured budget variance analysis course online to deepen your skills.
—
6. Practical Tips for Newbies

Here are some grounded, real‑world tips when you’re just starting:
– Document assumptions.
When you build or receive a budget, write down what it assumes: price levels, volumes, staffing, seasonality. Later, this makes variance explanations much easier.
– Use comments, not just numbers.
Add short notes in your Excel file or reporting tool: “Price increase from supplier X in May” or “Launch of new product line in Q2”. Future you will be very thankful.
– Compare to both last period and last year.
Budget vs actual is one comparison. Actual this period vs last period or vs the same period last year gives extra context about trends.
– Keep a “variance diary”.
A simple document where you log big variances and reasons each month helps you see patterns over time.
—
7. Tools and Templates: What People Use in 2025
7.1 Spreadsheets and templates
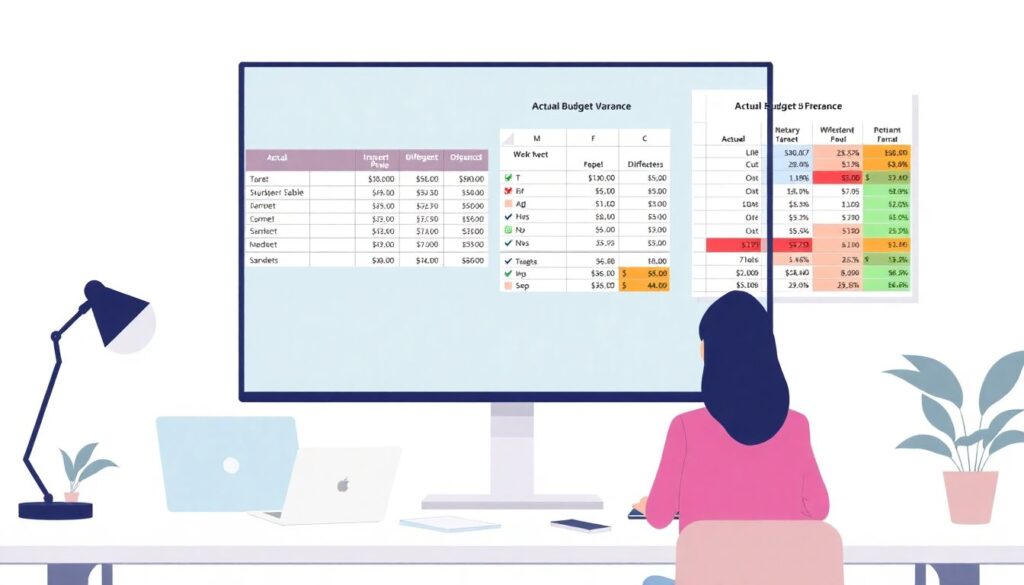
Most small teams and freelancers still live in spreadsheets. They download or build budget variance reporting templates Excel style:
– One sheet with the budget.
– One with actuals (maybe imported from accounting software).
– One “summary” sheet that pulls differences and highlights big gaps.
Spreadsheets are flexible, cheap, and familiar, but they require discipline: version control, clear formulas, and regular checks for errors.
—
7.2 Modern budgeting software
Larger organizations, and more and more small ones, are using budgeting and forecasting software with variance analysis built in. Typical features:
– Automatic pull of actuals from accounting/ERP.
– Dashboards for budget vs actual performance in real time.
– Drill‑down from a summary variance to the underlying transactions.
For a beginner, these tools can feel heavy at first, but they remove a lot of manual copy‑paste work and reduce the risk of formula errors.
—
7.3 Learning paths and courses
If you want to go beyond basics, a structured budget variance analysis course online can help you:
– Understand standard costing and formal variance formulas.
– Practice with real datasets.
– Learn how professionals write variance explanations for reports and boards.
You don’t need a course to start, but it speeds up the “I sort of get it” phase into “I know what I’m doing and can explain it to others.”
—
8. A Simple Example Walkthrough
Imagine you run a small online shop. For January, your budget is:
– Revenue: $40,000
– Cost of goods sold: $20,000
– Marketing: $5,000
– Other expenses: $10,000
– Planned profit: $5,000
Actual January:
– Revenue: $35,000
– Cost of goods sold: $18,000
– Marketing: $7,000
– Other expenses: $9,000
– Actual profit: $1,000
Now, let’s walk through the steps.
1. Big picture
– Revenue variance: -$5,000 (unfavorable)
– Total expense variance: -$1,000 (favorable: $18k+7k+9k = $34k vs budget $35k)
– Profit variance: -$4,000 (unfavorable)
2. Largest variances
– Revenue: -$5,000
– Marketing: +$2,000 (you spent more)
– Others are smaller.
3. Ask: price, quantity, timing, classification?
– Revenue: fewer units sold because a competitor launched a sale (quantity/market effect).
– Marketing: higher cost because you tested a new ad platform.
4. One‑off or structural?
– Competitor sale: maybe temporary, maybe monthly — watch for pattern.
– New ad platform: could be a useful experiment; see conversion data.
5. Actions
– Evaluate whether extra $2,000 in marketing brought in enough new customers.
– Decide whether to adjust prices or add promotions when competitors launch campaigns.
– Note these events in your variance report for better forecasting next quarter.
Suddenly, those variances aren’t just red and green numbers; they’re a story about competition, experiments, and strategy.
—
9. Turning Variances into Better Budgets
The real power of variance analysis is not in explaining the past; it’s in improving the next plan.
Here’s how to loop your learning back into budgeting:
– Adjust assumptions that keep being wrong.
If you’ve missed sales volume for six months straight, your market size or conversion assumptions are probably off.
– Build in seasonality.
If every December beats budget and every January misses, your budget is too flat. Make it reflect reality.
– Add contingency.
If you constantly face unplanned repairs or small unexpected expenses, add a modest “miscellaneous” or contingency line.
– Refine your drivers.
Move from “top‑down guessing” to driver‑based budgeting: sales based on units x price, staffing based on hours per project, etc. Variance analysis will then tell you whether the drivers are realistic.
Over a year or two, consistent analysis turns an unreliable budget into a useful map of what’s likely to happen.
—
10. Quick Checklist Before You Finish Any Variance Review
Use this short checklist every month or quarter:
– Did I:
– Look at the big picture before diving into details?
– Focus on the largest and most important variances?
– Separate one‑off events from recurring patterns?
– Check for timing differences across periods?
– Write short, clear explanations in plain language?
– Propose at least one action or decision per major variance?
If the answer is “yes” to most of these, you’re doing variance analysis at a level many professionals struggle to reach.
—
Understanding budget variances doesn’t require a finance degree. It requires curiosity about the gap between plan and reality, a simple structure for analysis, and the habit of turning insights into action.
You now have that structure. The next step is to take your own budget, run through the steps, and start asking “why” until the story behind the numbers becomes clear.